Reroute for Operations
Know where demand is. Reach it before traffic does.
Mobility infrastructure for teams that move concentrated flows of people, couriers, and fleets across the GTA. See demand, courier reach, and the corridors that wreck ETAs, on one live map.
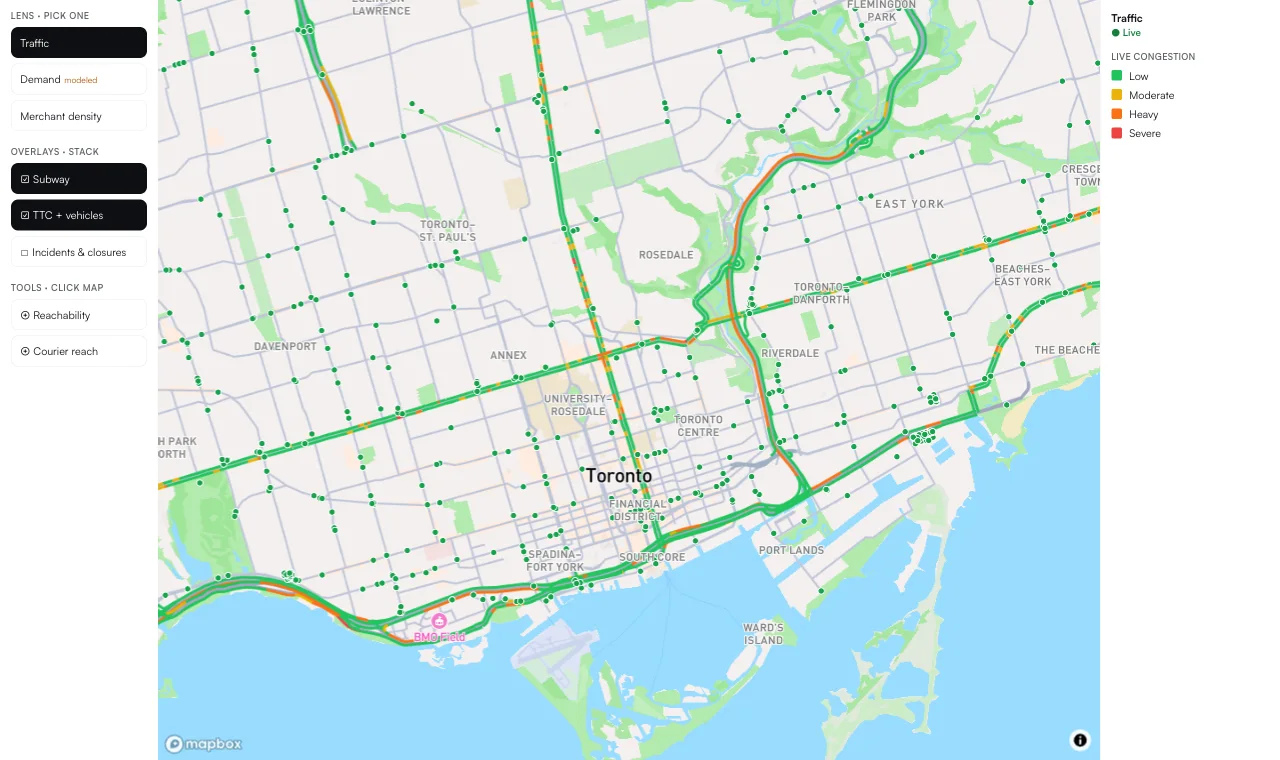
Operations teams fly blind on demand and traffic.
Schedules say one thing, the road says another. Couriers idle where demand has already moved, and one clogged corridor quietly wrecks every ETA behind it. The data exists, it just is not on one map.
Schedules lie under load
Posted times do not reflect the road. Mixed-traffic buses lose minutes nobody planned for.
Couriers idle in the wrong place
Staging follows yesterday's guess, not where demand has actually concentrated today.
One corridor cascades
A single clogged segment quietly wrecks every ETA behind it, and you find out from customers.
Capabilities
One platform for demand, traffic, and reach.
Six signals operations teams actually use, on one live map. Every number is labeled for what it is, and what it is not.
Delay risk
How likely a line runs late versus typical, learned from roughly 400,000 real TTC delay records since 2022, weather, and live disruptions. Not a percent-chance gimmick.
Relative risk, not % chance~400k
TTC delay records trained on
Multimodal routing
Transit, driving, walking, and hybrid park-and-ride, ranked by fastest, cheapest, or least stressful, with itemized cost.
Live traffic and congestion
Per-segment congestion, plus a surface-transit penalty that adds the minutes buses and mixed-traffic streetcars lose sitting in car traffic.
Demand intelligence
Where people concentrate by time of day. Modeled from population and merchant density, clearly labeled, and never presented as order data.
Modeled, not order dataCourier reachability
What a rider or driver can reach in 10, 20, or 30 minutes from any point or hub.
Connection confidence
Per-transfer make-it odds from live or scheduled buffers, a distinct and honest signal from delay risk.
Whatever your team calls it, this is the map for it.
Built for the people who keep things moving.
Stage couriers near demand
Spot the corridors that kill ETAs
Plan fleets and sites
Event egress
Coming soonHow it works
From raw feeds to one live picture.
Forty-plus agencies, live traffic, weather, and delay history, resolved into one call your team can act on.
One API call
Query transit, driving, walking, and hybrid across 40+ GTA agencies in a single request, with a response in about a second.
One dashboard
Demand, congestion, delay risk, reachability, and connection confidence, every layer labeled for exactly what it measures.
One live map
Live TTC and GO vehicles, alerts, and arrivals on the same canvas as your corridors and staging decisions, in real time.
Honest data, graceful under failure.
The signals are only useful if you can trust them. We label what is measured versus modeled, degrade safely, and expose our own health.
Modeled vs measured, always labeled
Demand is modeled from population and merchant density. Delay is relative risk, not a percent chance. Every layer says which it is.
Degrades gracefully
If transit data drops, transit simply goes quiet with a clear warning. Driving and walking keep working, so the dashboard never goes dark.
Observable health
Engine status endpoints report which feeds and engines are live, so your team always knows what the map is built on right now.
Pricing
Start with a pilot.
No cost during the beta. Bring your corridor, we will map it live and scope what scaling looks like for your operation.
Start a pilot
Free while in beta
The full dashboard plus a working session with our team on your corridor.
- Full operations dashboard access
- Live working session on your corridor
- 40+ agencies, live TTC + GO, delay risk
- Demand and reachability layers
Scale with us
Custom
Pricing scoped to your data, regions, and integration needs.
- Everything in the pilot
- API access for your own systems
- Additional regions and data sources
- Integration support and SLAs
Live map
Play with the real thing.
Toggle traffic, transit, demand, and incidents, then drop a pin to see courier reach. This is the same engine behind the full dashboard.
See your city the way your operation actually moves.
Book a 30 minute pilot session and we will map your corridor live.
or email us